Blank Map of Texas (Counties)
Printable map of Texas with all 254 counties, in four versions — blank, labeled, colored and with cities. Download as SVG, PNG or PDF. Public-domain data, no watermark.
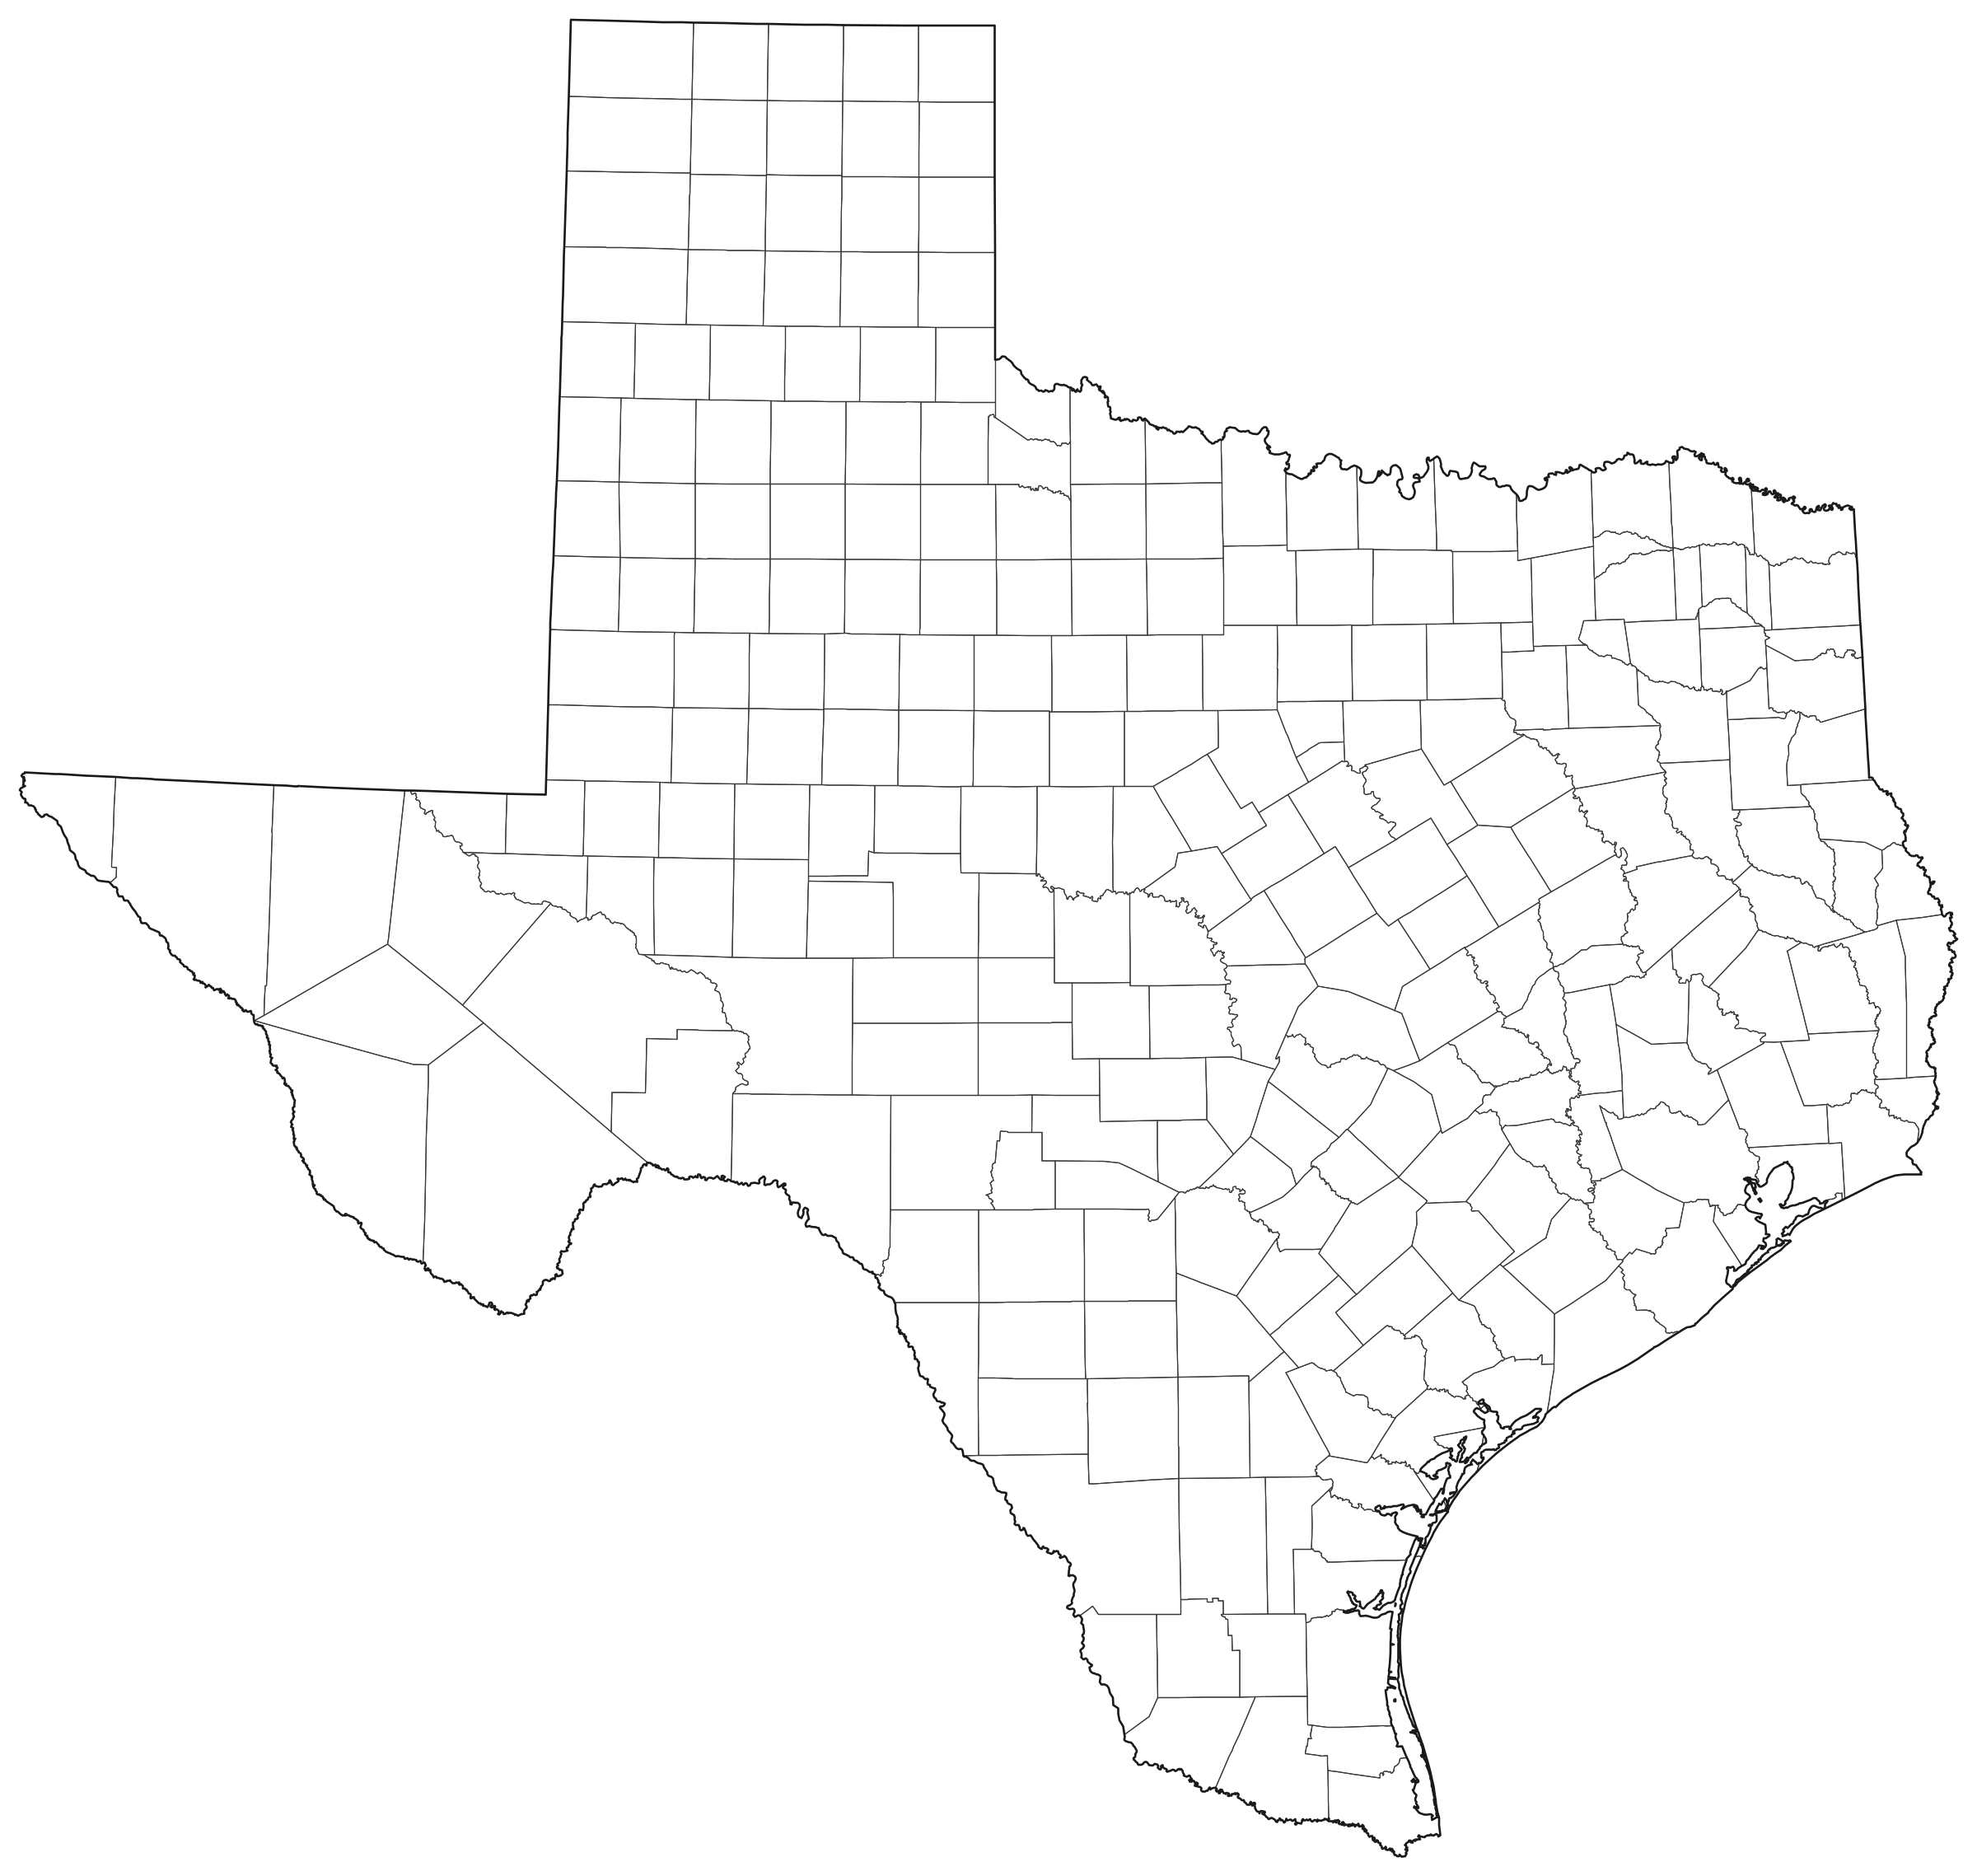
Outlines only — no labels, no fill.
SVG (vector)
Any size, editable in Inkscape, Illustrator or Figma.
PNG and PDF files are drawn in your browser at the size you pick; nothing is uploaded. No watermark, no sign-up.
Texas at a glance
| Counties on the map | 254 |
| Land area (sum of the shapes) | 676,659 km² · 261,260 mi² |
| Largest county by land area | Brewster County — 16,016 km² |
| Smallest county by land area | Rockwall County — 329 km² |
| Population (ACS 2019–2023) | 29,640,343 |
| Most populous county | Harris County — 4,758,579 |
| Places on the with-cities version | Houston, San Antonio, Dallas, Austin, Fort Worth, El Paso, Arlington, Corpus Christi, Plano, Lubbock |
Land areas are the Census Bureau's ALAND figures. Population and income are American Community Survey 5-year estimates, which carry margins of error. Cities are the largest Census places by ACS population; a crowded label is left off rather than overlapped.
All 254 counties of Texas
| County | Land area, km² | Land area, mi² | Population | Median household income |
|---|---|---|---|---|
| Anderson County | 2,752 | 1,063 | 57,825 | $58,846 |
| Andrews County | 3,887 | 1,501 | 18,518 | $76,902 |
| Angelina County | 2,066 | 798 | 86,791 | $58,847 |
| Aransas County | 653 | 252 | 24,449 | $61,754 |
| Archer County | 2,340 | 903 | 8,734 | $71,958 |
| Armstrong County | 2,355 | 909 | 1,883 | $68,462 |
| Atascosa County | 3,159 | 1,220 | 50,058 | $69,413 |
| Austin County | 1,674 | 646 | 30,712 | $75,994 |
| Bailey County | 2,142 | 827 | 7,044 | $70,625 |
| Bandera County | 2,049 | 791 | 21,589 | $69,703 |
| Bastrop County | 2,301 | 888 | 102,370 | $82,730 |
| Baylor County | 2,247 | 868 | 3,464 | $42,313 |
| Bee County | 2,280 | 880 | 31,000 | $56,075 |
| Bell County | 2,729 | 1,054 | 379,811 | $66,051 |
| Bexar County | 3,213 | 1,241 | 2,037,344 | $70,571 |
| Blanco County | 1,837 | 709 | 12,008 | $87,564 |
| Borden County | 2,324 | 897 | 723 | $64,250 |
| Bosque County | 2,546 | 983 | 18,546 | $69,339 |
| Bowie County | 2,292 | 885 | 92,321 | $59,295 |
| Brazoria County | 3,531 | 1,363 | 381,650 | $95,155 |
| Brazos County | 1,518 | 586 | 237,980 | $58,388 |
| Brewster County | 16,016 | 6,184 | 9,464 | $52,612 |
| Briscoe County | 2,331 | 900 | 1,223 | $41,188 |
| Brooks County | 2,443 | 943 | 6,987 | $31,310 |
| Brown County | 2,446 | 944 | 38,294 | $55,305 |
| Burleson County | 1,707 | 659 | 18,327 | $72,888 |
| Burnet County | 2,577 | 995 | 51,064 | $77,158 |
| Caldwell County | 1,410 | 544 | 47,184 | $68,503 |
| Calhoun County | 1,313 | 507 | 19,921 | $71,870 |
| Callahan County | 2,329 | 899 | 14,017 | $68,455 |
| Cameron County | 2,310 | 892 | 423,192 | $51,334 |
| Camp County | 507 | 196 | 12,652 | $55,061 |
| Carson County | 2,383 | 920 | 5,802 | $84,583 |
| Cass County | 2,427 | 937 | 28,582 | $54,328 |
| Castro County | 2,317 | 895 | 7,328 | $63,485 |
| Chambers County | 1,547 | 597 | 49,178 | $108,114 |
| Cherokee County | 2,727 | 1,053 | 51,143 | $59,830 |
| Childress County | 1,804 | 697 | 6,772 | $60,333 |
| Clay County | 2,820 | 1,089 | 10,402 | $77,355 |
| Cochran County | 2,007 | 775 | 2,520 | $42,137 |
| Coke County | 2,361 | 912 | 3,315 | $46,431 |
| Coleman County | 3,271 | 1,263 | 7,765 | $52,364 |
| Collin County | 2,179 | 841 | 1,116,601 | $117,588 |
| Collingsworth County | 2,379 | 919 | 2,733 | $60,165 |
| Colorado County | 2,487 | 960 | 20,736 | $68,554 |
| Comal County | 1,449 | 559 | 174,552 | $99,015 |
| Comanche County | 2,429 | 938 | 13,786 | $59,946 |
| Concho County | 2,548 | 984 | 3,301 | $59,632 |
| Cooke County | 2,266 | 875 | 42,473 | $72,472 |
| Coryell County | 2,725 | 1,052 | 83,772 | $68,904 |
| Cottle County | 2,332 | 900 | 1,302 | $58,819 |
| Crane County | 2,033 | 785 | 4,623 | $59,915 |
| Crockett County | 7,271 | 2,807 | 2,881 | $81,739 |
| Crosby County | 2,332 | 900 | 5,072 | $52,197 |
| Culberson County | 9,873 | 3,812 | 2,181 | $42,672 |
| Dallam County | 3,894 | 1,503 | 7,180 | $72,332 |
| Dallas County | 2,261 | 873 | 2,603,816 | $74,149 |
| Dawson County | 2,332 | 900 | 12,311 | $55,789 |
| Deaf Smith County | 3,877 | 1,497 | 18,487 | $54,114 |
| Delta County | 665 | 257 | 5,345 | $62,855 |
| Denton County | 2,276 | 879 | 945,644 | $108,185 |
| DeWitt County | 2,354 | 909 | 19,853 | $64,014 |
| Dickens County | 2,335 | 902 | 1,641 | $50,417 |
| Dimmit County | 3,442 | 1,329 | 8,507 | $33,409 |
| Donley County | 2,401 | 927 | 3,276 | $56,648 |
| Duval County | 4,645 | 1,793 | 9,824 | $50,081 |
| Eastland County | 2,400 | 927 | 17,846 | $51,741 |
| Ector County | 2,326 | 898 | 163,206 | $71,031 |
| Edwards County | 5,485 | 2,118 | 1,392 | $38,500 |
| El Paso County | 2,625 | 1,014 | 866,275 | $58,859 |
| Ellis County | 2,424 | 936 | 203,927 | $95,898 |
| Erath County | 2,805 | 1,083 | 43,244 | $65,351 |
| Falls County | 1,983 | 766 | 17,063 | $55,372 |
| Fannin County | 2,274 | 878 | 36,525 | $68,377 |
| Fayette County | 2,460 | 950 | 24,783 | $76,541 |
| Fisher County | 2,328 | 899 | 3,661 | $64,700 |
| Floyd County | 2,570 | 992 | 5,294 | $55,461 |
| Foard County | 1,824 | 704 | 1,079 | $42,212 |
| Fort Bend County | 2,232 | 862 | 859,721 | $113,409 |
| Franklin County | 737 | 285 | 10,522 | $66,800 |
| Freestone County | 2,273 | 878 | 19,813 | $58,460 |
| Frio County | 2,936 | 1,134 | 18,019 | $60,098 |
| Gaines County | 3,891 | 1,502 | 21,904 | $76,605 |
| Galveston County | 983 | 380 | 354,721 | $85,348 |
| Garza County | 2,314 | 893 | 5,435 | $50,545 |
| Gillespie County | 2,741 | 1,058 | 27,202 | $67,799 |
| Glasscock County | 2,332 | 900 | 1,070 | $106,806 |
| Goliad County | 2,207 | 852 | 7,096 | $59,556 |
| Gonzales County | 2,763 | 1,067 | 19,764 | $59,355 |
| Gray County | 2,398 | 926 | 21,131 | $56,082 |
| Grayson County | 2,416 | 933 | 139,988 | $70,455 |
| Gregg County | 708 | 273 | 124,860 | $64,809 |
| Grimes County | 2,040 | 788 | 30,385 | $67,080 |
| Guadalupe County | 1,842 | 711 | 178,368 | $93,776 |
| Hale County | 2,602 | 1,005 | 32,247 | $52,788 |
| Hall County | 2,288 | 883 | 2,827 | $46,728 |
| Hamilton County | 2,165 | 836 | 8,320 | $55,339 |
| Hansford County | 2,382 | 920 | 5,182 | $68,299 |
| Hardeman County | 1,800 | 695 | 3,529 | $61,179 |
| Hardin County | 2,307 | 891 | 57,126 | $72,532 |
| Harris County | 4,422 | 1,707 | 4,758,579 | $73,104 |
| Harrison County | 2,331 | 900 | 69,584 | $66,040 |
| Hartley County | 3,786 | 1,462 | 5,307 | $82,122 |
| Haskell County | 2,339 | 903 | 5,390 | $54,044 |
| Hays County | 1,753 | 677 | 256,429 | $85,827 |
| Hemphill County | 2,347 | 906 | 3,311 | $72,052 |
| Henderson County | 2,263 | 874 | 83,658 | $63,955 |
| Hidalgo County | 4,069 | 1,571 | 880,921 | $52,281 |
| Hill County | 2,483 | 959 | 36,664 | $63,147 |
| Hockley County | 2,353 | 908 | 21,455 | $54,810 |
| Hood County | 1,090 | 421 | 64,198 | $86,802 |
| Hopkins County | 1,988 | 768 | 37,351 | $64,725 |
| Houston County | 3,188 | 1,231 | 22,042 | $54,563 |
| Howard County | 2,333 | 901 | 33,127 | $71,457 |
| Hudspeth County | 11,838 | 4,571 | 3,331 | $39,336 |
| Hunt County | 2,177 | 841 | 104,917 | $70,112 |
| Hutchinson County | 2,298 | 887 | 20,413 | $65,470 |
| Irion County | 2,723 | 1,051 | 1,432 | $58,125 |
| Jack County | 2,359 | 911 | 8,623 | $65,693 |
| Jackson County | 2,148 | 829 | 15,081 | $61,752 |
| Jasper County | 2,431 | 939 | 32,807 | $49,919 |
| Jeff Davis County | 5,865 | 2,264 | 1,740 | $32,625 |
| Jefferson County | 2,271 | 877 | 253,939 | $59,934 |
| Jim Hogg County | 2,943 | 1,136 | 4,797 | $42,230 |
| Jim Wells County | 2,241 | 865 | 38,863 | $47,492 |
| Johnson County | 1,878 | 725 | 188,820 | $81,826 |
| Jones County | 2,405 | 929 | 19,968 | $63,472 |
| Karnes County | 1,937 | 748 | 14,819 | $59,103 |
| Kaufman County | 2,022 | 781 | 160,718 | $88,606 |
| Kendall County | 1,716 | 663 | 46,971 | $110,498 |
| Kenedy County | 3,778 | 1,459 | 52 | — |
| Kent County | 2,337 | 902 | 727 | $71,420 |
| Kerr County | 2,858 | 1,103 | 53,166 | $67,927 |
| Kimble County | 3,240 | 1,251 | 4,355 | $65,703 |
| King County | 2,359 | 911 | 189 | $70,192 |
| Kinney County | 3,524 | 1,361 | 3,140 | $66,341 |
| Kleberg County | 2,283 | 881 | 30,629 | $57,612 |
| Knox County | 2,203 | 851 | 3,322 | $56,304 |
| La Salle County | 3,851 | 1,487 | 6,946 | $55,469 |
| Lamar County | 2,350 | 907 | 50,421 | $61,122 |
| Lamb County | 2,632 | 1,016 | 12,919 | $56,997 |
| Lampasas County | 1,845 | 712 | 22,267 | $76,919 |
| Lavaca County | 2,512 | 970 | 20,479 | $61,768 |
| Lee County | 1,629 | 629 | 17,758 | $66,000 |
| Leon County | 2,779 | 1,073 | 16,067 | $59,975 |
| Liberty County | 3,000 | 1,158 | 97,993 | $64,773 |
| Limestone County | 2,345 | 905 | 22,185 | $58,109 |
| Lipscomb County | 2,414 | 932 | 2,964 | $71,442 |
| Live Oak County | 2,693 | 1,040 | 11,444 | $53,869 |
| Llano County | 2,419 | 934 | 22,011 | $65,636 |
| Loving County | 1,732 | 669 | 54 | $51,087 |
| Lubbock County | 2,320 | 896 | 314,633 | $63,367 |
| Lynn County | 2,310 | 892 | 5,667 | $57,411 |
| Madison County | 1,207 | 466 | 13,574 | $67,128 |
| Marion County | 987 | 381 | 9,631 | $47,447 |
| Martin County | 2,370 | 915 | 5,230 | $77,083 |
| Mason County | 2,406 | 929 | 3,951 | $68,750 |
| Matagorda County | 2,831 | 1,093 | 36,274 | $55,174 |
| Maverick County | 3,314 | 1,280 | 57,770 | $51,270 |
| McCulloch County | 2,760 | 1,066 | 7,565 | $51,919 |
| McLennan County | 2,685 | 1,037 | 263,608 | $63,888 |
| McMullen County | 2,952 | 1,140 | 623 | $45,833 |
| Medina County | 3,433 | 1,325 | 52,419 | $73,462 |
| Menard County | 2,336 | 902 | 1,964 | $48,191 |
| Midland County | 2,332 | 900 | 171,496 | $93,984 |
| Milam County | 2,632 | 1,016 | 25,268 | $59,076 |
| Mills County | 1,938 | 748 | 4,499 | $64,494 |
| Mitchell County | 2,360 | 911 | 8,989 | $56,033 |
| Montague County | 2,411 | 931 | 20,599 | $62,818 |
| Montgomery County | 2,699 | 1,042 | 654,722 | $97,266 |
| Moore County | 2,330 | 900 | 21,234 | $61,325 |
| Morris County | 653 | 252 | 12,014 | $55,082 |
| Motley County | 2,563 | 990 | 1,267 | $62,857 |
| Nacogdoches County | 2,451 | 946 | 64,897 | $51,528 |
| Navarro County | 2,615 | 1,010 | 53,735 | $59,310 |
| Newton County | 2,418 | 934 | 12,193 | $41,044 |
| Nolan County | 2,362 | 912 | 14,565 | $50,160 |
| Nueces County | 2,174 | 839 | 352,829 | $66,021 |
| Ochiltree County | 2,377 | 918 | 9,852 | $64,988 |
| Oldham County | 3,886 | 1,500 | 2,097 | $76,402 |
| Orange County | 865 | 334 | 84,993 | $73,372 |
| Palo Pinto County | 2,467 | 953 | 28,920 | $64,972 |
| Panola County | 2,101 | 811 | 22,624 | $62,593 |
| Parker County | 2,341 | 904 | 158,079 | $102,099 |
| Parmer County | 2,281 | 881 | 9,752 | $68,164 |
| Pecos County | 12,338 | 4,764 | 14,983 | $67,689 |
| Polk County | 2,738 | 1,057 | 51,780 | $59,066 |
| Potter County | 2,353 | 908 | 116,634 | $50,448 |
| Presidio County | 9,985 | 3,855 | 6,043 | $29,014 |
| Rains County | 594 | 229 | 12,505 | $64,874 |
| Randall County | 2,364 | 913 | 143,791 | $80,905 |
| Reagan County | 3,044 | 1,175 | 3,259 | $70,288 |
| Real County | 1,811 | 699 | 2,821 | $45,417 |
| Red River County | 2,704 | 1,044 | 11,621 | $46,912 |
| Reeves County | 6,826 | 2,636 | 13,219 | $56,056 |
| Refugio County | 1,996 | 771 | 6,693 | $58,016 |
| Roberts County | 2,393 | 924 | 785 | $66,118 |
| Robertson County | 2,215 | 855 | 16,973 | $66,250 |
| Rockwall County | 329 | 127 | 116,931 | $124,917 |
| Runnels County | 2,722 | 1,051 | 9,880 | $63,490 |
| Rusk County | 2,394 | 924 | 52,613 | $67,506 |
| Sabine County | 1,274 | 492 | 9,998 | $59,924 |
| San Augustine County | 1,374 | 531 | 7,889 | $46,338 |
| San Jacinto County | 1,474 | 569 | 27,983 | $59,526 |
| San Patricio County | 1,796 | 693 | 69,519 | $67,512 |
| San Saba County | 2,940 | 1,135 | 5,802 | $54,855 |
| Schleicher County | 3,395 | 1,311 | 2,426 | $90,141 |
| Scurry County | 2,345 | 905 | 16,633 | $62,689 |
| Shackelford County | 2,368 | 914 | 3,169 | $64,659 |
| Shelby County | 2,061 | 796 | 24,108 | $50,436 |
| Sherman County | 2,390 | 923 | 2,434 | $74,167 |
| Smith County | 2,387 | 922 | 238,014 | $71,923 |
| Somervell County | 482 | 186 | 9,510 | $83,382 |
| Starr County | 3,168 | 1,223 | 65,809 | $38,182 |
| Stephens County | 2,322 | 897 | 9,278 | $54,695 |
| Sterling County | 2,392 | 924 | 1,389 | $78,750 |
| Stonewall County | 2,373 | 916 | 1,244 | $61,250 |
| Sutton County | 3,766 | 1,454 | 3,306 | $75,000 |
| Swisher County | 2,306 | 890 | 6,981 | $39,031 |
| Tarrant County | 2,241 | 865 | 2,135,743 | $81,905 |
| Taylor County | 2,371 | 915 | 144,259 | $66,406 |
| Terrell County | 6,107 | 2,358 | 851 | $46,989 |
| Terry County | 2,302 | 889 | 11,699 | $45,905 |
| Throckmorton County | 2,363 | 912 | 1,589 | $58,864 |
| Titus County | 1,052 | 406 | 31,284 | $59,220 |
| Tom Green County | 3,943 | 1,522 | 119,398 | $66,254 |
| Travis County | 2,575 | 994 | 1,307,625 | $97,169 |
| Trinity County | 1,797 | 694 | 13,850 | $51,663 |
| Tyler County | 2,394 | 924 | 20,084 | $50,647 |
| Upshur County | 1,510 | 583 | 41,864 | $62,794 |
| Upton County | 3,215 | 1,241 | 3,227 | $52,321 |
| Uvalde County | 4,019 | 1,552 | 24,810 | $57,849 |
| Val Verde County | 8,145 | 3,145 | 47,647 | $59,673 |
| Van Zandt County | 2,182 | 842 | 61,323 | $68,274 |
| Victoria County | 2,285 | 882 | 91,281 | $70,101 |
| Walker County | 2,031 | 784 | 78,292 | $49,862 |
| Waller County | 1,329 | 513 | 59,455 | $76,135 |
| Ward County | 2,164 | 836 | 11,255 | $71,719 |
| Washington County | 1,565 | 604 | 36,156 | $75,085 |
| Webb County | 8,706 | 3,361 | 267,731 | $62,506 |
| Wharton County | 2,813 | 1,086 | 41,651 | $66,100 |
| Wheeler County | 2,369 | 915 | 4,902 | $67,964 |
| Wichita County | 1,625 | 627 | 129,842 | $62,168 |
| Wilbarger County | 2,515 | 971 | 12,712 | $51,626 |
| Willacy County | 1,530 | 591 | 20,218 | $45,645 |
| Williamson County | 2,890 | 1,116 | 643,889 | $108,309 |
| Wilson County | 2,082 | 804 | 51,501 | $92,461 |
| Winkler County | 2,179 | 841 | 7,540 | $91,898 |
| Wise County | 2,343 | 905 | 72,359 | $89,897 |
| Wood County | 1,671 | 645 | 46,094 | $62,524 |
| Yoakum County | 2,071 | 800 | 7,589 | $82,261 |
| Young County | 2,369 | 915 | 17,963 | $63,723 |
| Zapata County | 2,586 | 998 | 13,855 | $36,527 |
| Zavala County | 3,360 | 1,297 | 9,532 | $41,887 |
Printing and using the map
- Pick a version with the tabs above the map. Blank is outlines only; Labeled names each county.
- For paper, choose PDF and your page size. Wide maps are placed on a landscape page automatically.
- Print at 100% or “Fit to page”. The PDF already leaves a half-inch margin.
- For slides or documents, a 1,200 or 2,400 px PNG is enough. For a poster, use the 4,800 px PNG or the SVG.
- To colour counties by your own data, open the SVG in a design program: each county is a separate path carrying its name.
About the boundaries
The county shapes are the US Census Bureau's 2024 cartographic boundary file — boundaries as of January 1, 2024, clipped to the shoreline for mapping.
The map uses an equal-area projection (Lambert azimuthal equal-area, centred on the map), so counties keep their true relative sizes. It is simplified to about the detail visible at 2400 × 2277 pixels, and coloured so that no two touching counties share a colour. The colours carry no meaning.
Limits: shorelines and small islands are generalised, very small counties may be hard to see at letter size, and the map shows administrative divisions only — no rivers, roads or terrain. It is for teaching, illustration and planning, not for legal, survey or navigation use.
Sources
- US Census Bureau, 2024 Cartographic Boundary Files — counties, 1:500,000 (cb_2024_us_county_500k)
- American Community Survey 2019–2023 5-year estimates — population (table B01003) and median household income (B19013), table-based summary file
- Census Gazetteer Files 2024 — city locations for the with-cities version
Source files downloaded October 18, 2026.
Frequently asked questions
How many counties are on this map of Texas?
254. every one of them is listed in the table on this page.
Can I use these maps for free, including commercially?
Yes. The maps are drawn from public-domain boundary data (US Census Bureau) and this site adds no restrictions: use them in worksheets, slides, videos, products and print without attribution.
Which file should I download for printing?
The PDF, sized for your paper. It holds a 200 dpi image scaled to fit inside a half-inch margin and turns landscape automatically for wide maps. The SVG is vector and prints sharp at any size from a design program.
Do the four versions line up with each other?
Yes. The labeled, colored and with-cities versions are the blank SVG with labels, fills or city markers added on top, so the borders are identical. Print the blank one as a quiz and the labeled one as the answer key.
Why are some labels shortened?
Labels are sized to fit inside each county. Where a name cannot fit even at the smallest readable size it is shortened with an ellipsis or replaced by its abbreviation. The full names are in the table below the map.
How accurate are the borders?
They come from the Census Bureau's 2024 cartographic boundary file, generalised for mapping, then simplified to suit a 2400 × 2277 pixel drawing. They are right for printing and teaching but are not survey-grade lines and must not be used to settle a boundary question.
More blank maps
- World
- United States
- Alabama
- Alaska
- Arizona
- Arkansas
- California
- Colorado
- Connecticut
- Delaware
- District of Columbia
- Florida
- Georgia
- Hawaii
- Idaho
- Illinois
- Indiana
- Iowa
- Kansas
- Kentucky
- Louisiana
- Maine
- Maryland
- Massachusetts
- Michigan
- Minnesota
- Mississippi
- Missouri
- Montana
- Nebraska
- Nevada
- New Hampshire
- New Jersey
- New Mexico
- New York
- North Carolina
- North Dakota
- Ohio
- Oklahoma
- Oregon
- Pennsylvania
- Rhode Island
- South Carolina
- South Dakota
- Tennessee
- Utah
- Vermont
- Virginia
- Washington
- West Virginia
- Wisconsin
- Wyoming
- All 110 maps →