Blank Map of Maryland (Counties)
Printable map of Maryland with all 24 counties and Baltimore city, in four versions — blank, labeled, colored and with cities. Download as SVG, PNG or PDF. Public-domain data, no watermark.
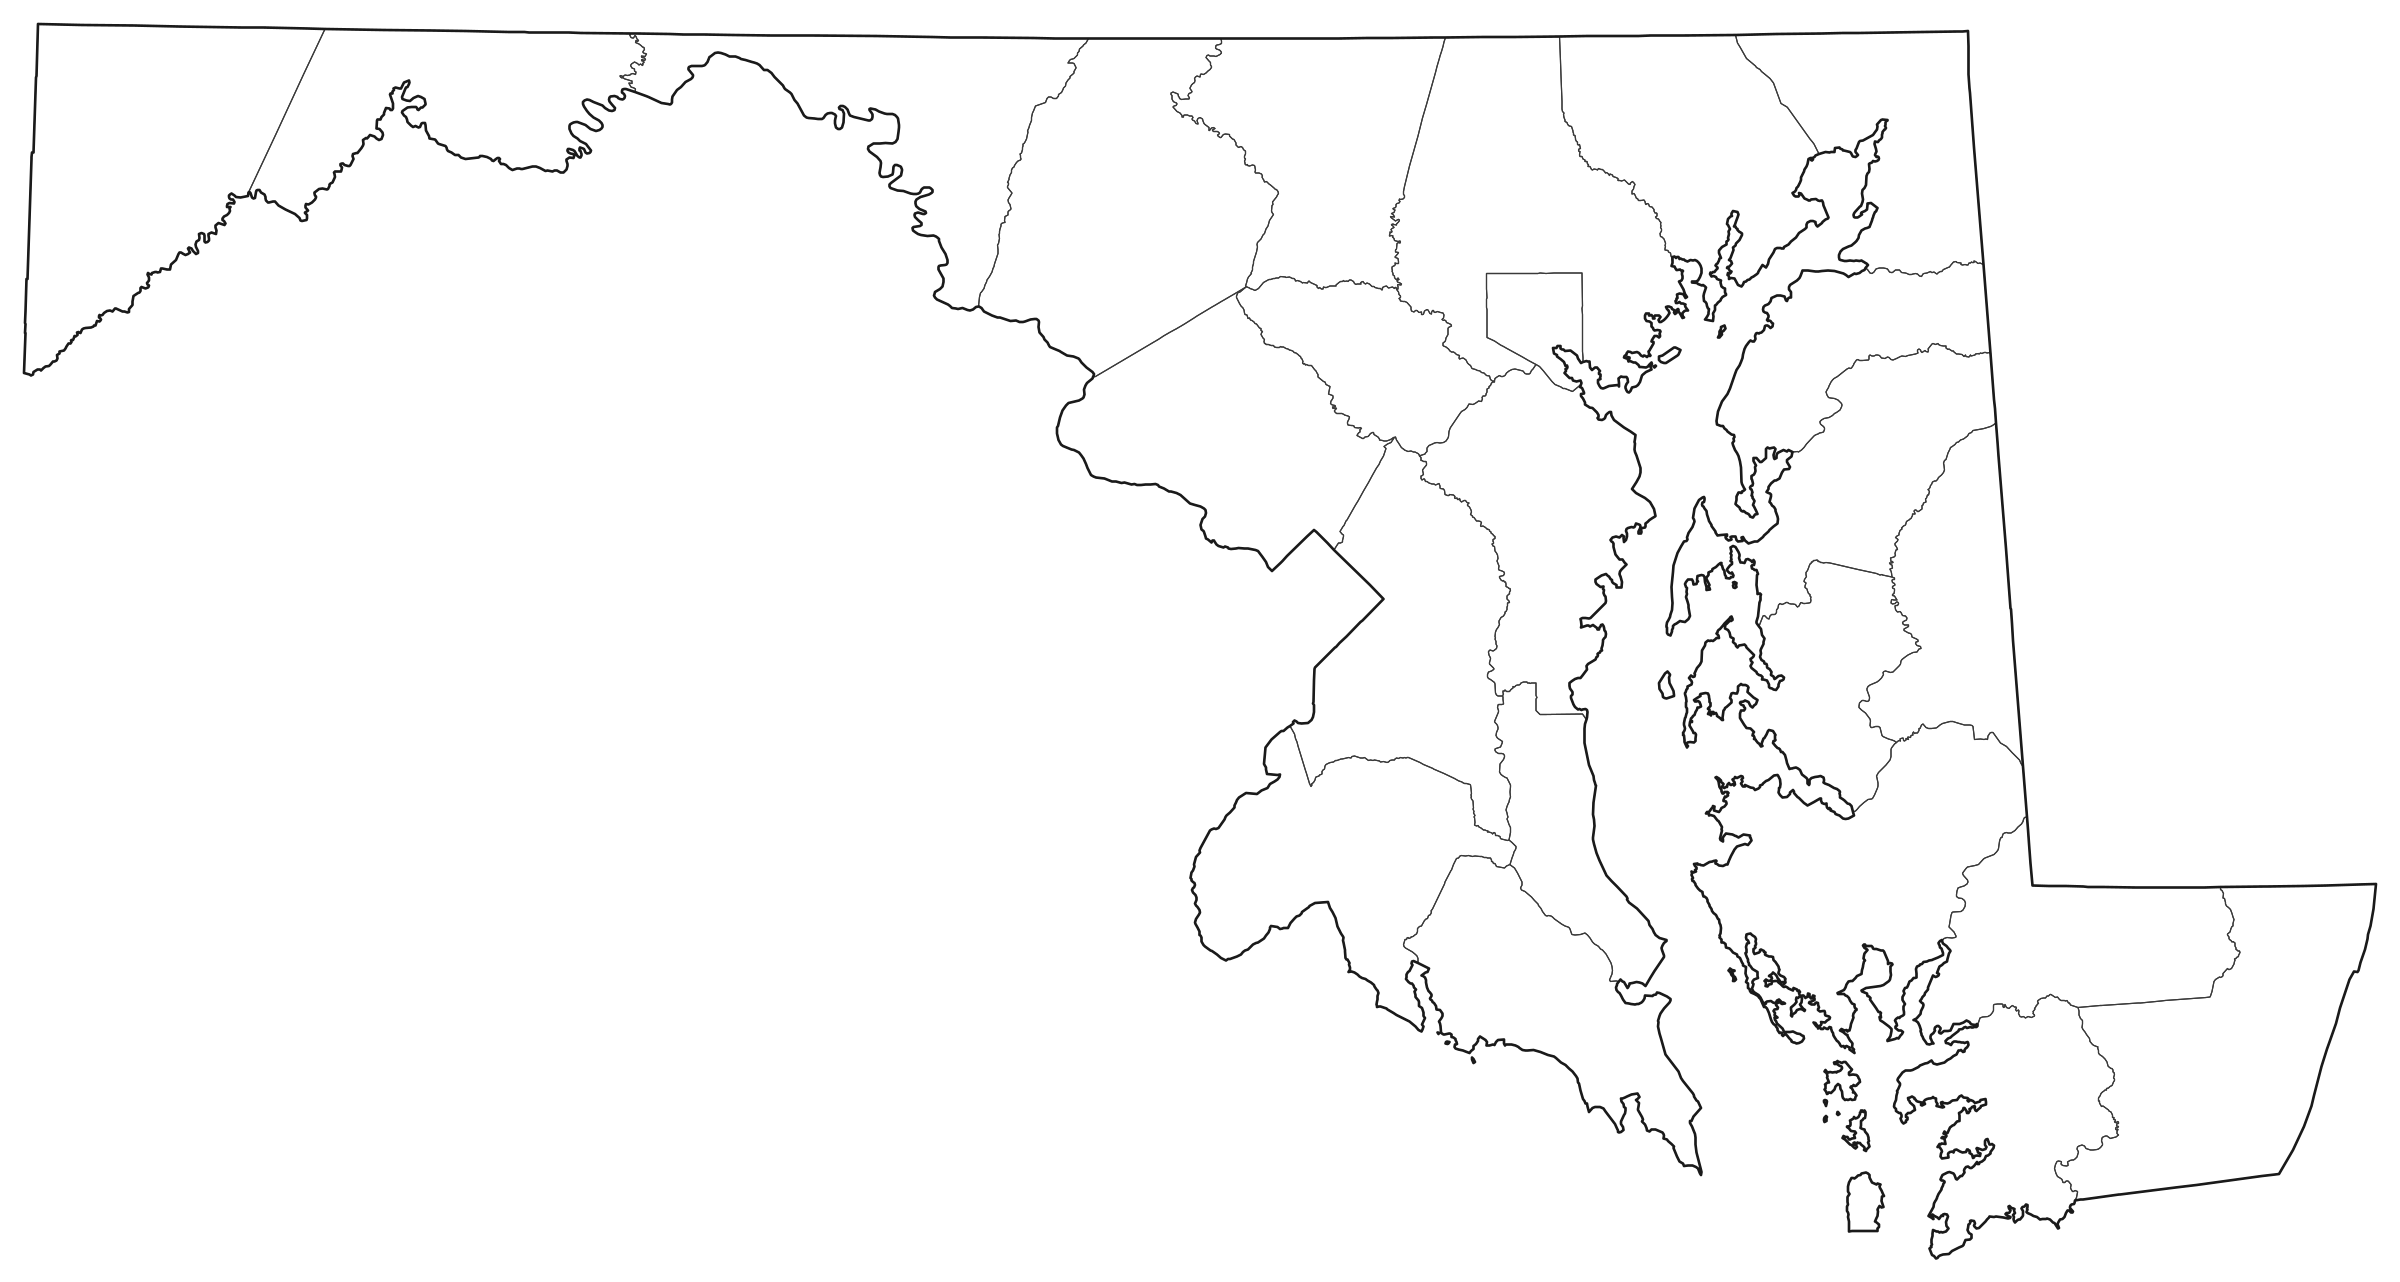
Outlines only — no labels, no fill.
SVG (vector)
Any size, editable in Inkscape, Illustrator or Figma.
PNG and PDF files are drawn in your browser at the size you pick; nothing is uploaded. No watermark, no sign-up.
Maryland at a glance
| Counties and Baltimore City on the map | 24 |
| Land area (sum of the shapes) | 25,152 km² · 9,711 mi² |
| Largest county by land area | Frederick County — 1,711 km² |
| Smallest county by land area | Baltimore city — 210 km² |
| Population (ACS 2019–2023) | 6,170,738 |
| Most populous county | Montgomery County — 1,057,586 |
| Places on the with-cities version | Baltimore, Columbia, Germantown, Waldorf, Silver Spring, Frederick, Ellicott City, Glen Burnie, Gaithersburg, Bethesda |
Land areas are the Census Bureau's ALAND figures. Population and income are American Community Survey 5-year estimates, which carry margins of error. Cities are the largest Census places by ACS population; a crowded label is left off rather than overlapped.
All 24 counties and Baltimore city of Maryland
| County | Land area, km² | Land area, mi² | Population | Median household income |
|---|---|---|---|---|
| Allegany County | 1,093 | 422 | 67,762 | $57,393 |
| Anne Arundel County | 1,074 | 415 | 590,936 | $120,324 |
| Baltimore County | 1,550 | 598 | 849,586 | $90,904 |
| Baltimore city | 210 | 81 | 577,193 | $59,623 |
| Calvert County | 552 | 213 | 93,791 | $132,059 |
| Caroline County | 827 | 319 | 33,406 | $66,368 |
| Carroll County | 1,159 | 447 | 174,318 | $115,876 |
| Cecil County | 897 | 346 | 104,366 | $91,146 |
| Charles County | 1,186 | 458 | 168,710 | $120,592 |
| Dorchester County | 1,401 | 541 | 32,612 | $60,495 |
| Frederick County | 1,711 | 661 | 280,341 | $120,458 |
| Garrett County | 1,681 | 649 | 28,713 | $69,031 |
| Harford County | 1,132 | 437 | 262,509 | $111,317 |
| Howard County | 650 | 251 | 333,916 | $146,982 |
| Kent County | 717 | 277 | 19,265 | $74,402 |
| Montgomery County | 1,277 | 493 | 1,057,586 | $128,733 |
| Prince George's County | 1,250 | 483 | 955,584 | $100,708 |
| Queen Anne's County | 963 | 372 | 50,951 | $113,347 |
| Somerset County | 828 | 320 | 24,685 | $52,462 |
| St. Mary's County | 929 | 359 | 114,372 | $114,580 |
| Talbot County | 696 | 269 | 37,707 | $84,378 |
| Washington County | 1,186 | 458 | 155,033 | $74,157 |
| Wicomico County | 970 | 375 | 104,117 | $72,861 |
| Worcester County | 1,213 | 468 | 53,279 | $81,455 |
Printing and using the map
- Pick a version with the tabs above the map. Blank is outlines only; Labeled names each county.
- For paper, choose PDF and your page size. Wide maps are placed on a landscape page automatically.
- Print at 100% or “Fit to page”. The PDF already leaves a half-inch margin.
- For slides or documents, a 1,200 or 2,400 px PNG is enough. For a poster, use the 4,800 px PNG or the SVG.
- To colour counties and Baltimore city by your own data, open the SVG in a design program: each county is a separate path carrying its name.
About the boundaries
The county shapes are the US Census Bureau's 2024 cartographic boundary file — boundaries as of January 1, 2024, clipped to the shoreline for mapping.
The map uses an equal-area projection (Lambert azimuthal equal-area, centred on the map), so counties and Baltimore city keep their true relative sizes. It is simplified to about the detail visible at 2400 × 1282 pixels, and coloured so that no two touching counties and Baltimore city share a colour. The colours carry no meaning.
Limits: shorelines and small islands are generalised, very small counties and Baltimore city may be hard to see at letter size, and the map shows administrative divisions only — no rivers, roads or terrain. It is for teaching, illustration and planning, not for legal, survey or navigation use.
Sources
- US Census Bureau, 2024 Cartographic Boundary Files — counties, 1:500,000 (cb_2024_us_county_500k)
- American Community Survey 2019–2023 5-year estimates — population (table B01003) and median household income (B19013), table-based summary file
- Census Gazetteer Files 2024 — city locations for the with-cities version
Source files downloaded October 18, 2026.
Frequently asked questions
How many counties and Baltimore city are on this map of Maryland?
24. every one of them is listed in the table on this page.
Can I use these maps for free, including commercially?
Yes. The maps are drawn from public-domain boundary data (US Census Bureau) and this site adds no restrictions: use them in worksheets, slides, videos, products and print without attribution.
Which file should I download for printing?
The PDF, sized for your paper. It holds a 200 dpi image scaled to fit inside a half-inch margin and turns landscape automatically for wide maps. The SVG is vector and prints sharp at any size from a design program.
Do the four versions line up with each other?
Yes. The labeled, colored and with-cities versions are the blank SVG with labels, fills or city markers added on top, so the borders are identical. Print the blank one as a quiz and the labeled one as the answer key.
Why are some labels shortened?
Labels are sized to fit inside each county. Where a name cannot fit even at the smallest readable size it is shortened with an ellipsis or replaced by its abbreviation. The full names are in the table below the map.
How accurate are the borders?
They come from the Census Bureau's 2024 cartographic boundary file, generalised for mapping, then simplified to suit a 2400 × 1282 pixel drawing. They are right for printing and teaching but are not survey-grade lines and must not be used to settle a boundary question.
More blank maps
- World
- United States
- Alabama
- Alaska
- Arizona
- Arkansas
- California
- Colorado
- Connecticut
- Delaware
- District of Columbia
- Florida
- Georgia
- Hawaii
- Idaho
- Illinois
- Indiana
- Iowa
- Kansas
- Kentucky
- Louisiana
- Maine
- Massachusetts
- Michigan
- Minnesota
- Mississippi
- Missouri
- Montana
- Nebraska
- Nevada
- New Hampshire
- New Jersey
- New Mexico
- New York
- North Carolina
- North Dakota
- Ohio
- Oklahoma
- Oregon
- Pennsylvania
- Rhode Island
- South Carolina
- South Dakota
- Tennessee
- Texas
- Utah
- Vermont
- Virginia
- Washington
- West Virginia
- Wisconsin
- Wyoming
- All 110 maps →